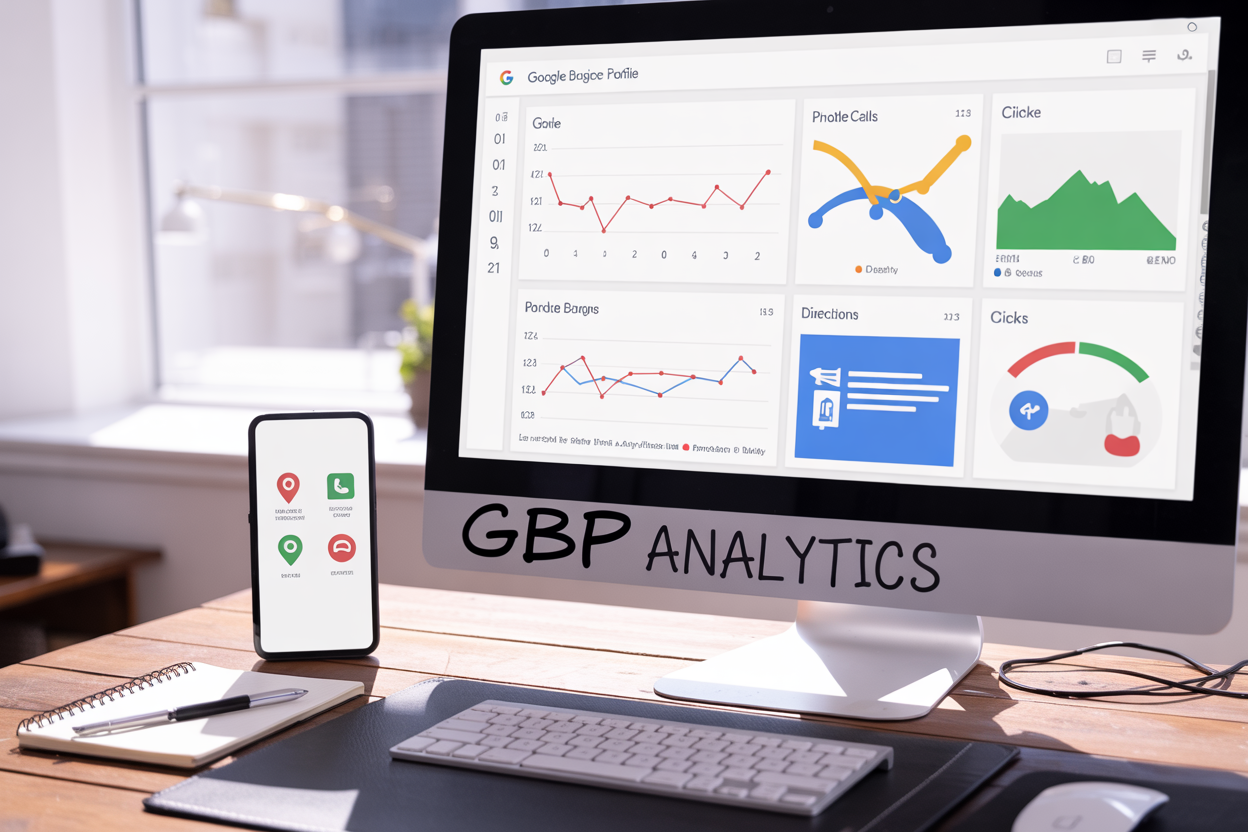
Small business owners and digital marketers know that tracking GBP analytics for phone calls, direction requests, and clicks is crucial for measuring local search performance. Your Google Business Profile generates valuable customer actions, but without proper analytics tracking, you’re missing key insights about how people discover and interact with your business online.
This guide is for local business owners, marketing managers, and SEO professionals who want to understand their Google Business Profile’s impact on customer behavior. Whether you’re running a single location or managing multiple business profiles, tracking these interactions helps you make smarter marketing decisions.
We’ll walk through the fundamentals of GBP analytics and show you how to set up comprehensive tracking systems. You’ll learn to master phone call tracking methods that reveal which marketing efforts drive the most calls. We’ll also cover how to optimize direction request performance and maximize insights from website click data, giving you the tools to turn your Google Business Profile into a powerful analytics-driven marketing asset.
Understanding GBP Analytics Fundamentals

Key metrics that drive local business growth
Google Business Profile analytics offer valuable insights through specific metrics that directly impact your local business success. Phone call volume stands out as one of the most important GBP analytics metrics, showing how many potential customers reached out directly after finding your business listing. This metric reveals immediate conversion intent and helps you measure the effectiveness of your profile optimization efforts.
Direction requests serve as another crucial indicator, demonstrating foot traffic potential and local customer interest. When combined with analytics tracking Google provides, these metrics paint a clear picture of customer behavior patterns. Website clicks from your GBP listing represent digital engagement, showing how effectively your profile drives traffic to your online presence.
Search views and discovery searches reveal your visibility performance across Google’s ecosystem. These analytic metrics help you understand whether customers find you through direct searches or discovery browsing. Photo views and customer actions like calling, messaging, or requesting quotes provide additional layers of insight into user engagement patterns.
How GBP data impacts search visibility
Your Google Business Profile analytics directly influence your local search rankings through Google’s algorithm. The platform uses engagement signals from your GBP analytics to determine how prominently your business appears in local search results and map listings.
Phone call frequency and direction requests signal to Google that your business attracts genuine customer interest, which can boost your local search visibility. Google Analytics 4 tracking integration allows you to connect these GBP interactions with broader website performance data, creating a comprehensive view of your digital footprint.
Review responses, post engagement, and photo uploads all contribute to your profile’s activity score. Google’s algorithm favors businesses that maintain active, engaging profiles with consistent customer interactions. Your analytics tracking plan should monitor these engagement signals alongside traditional website metrics to optimize your complete local search presence.
The relationship between GBP performance and search visibility creates a positive feedback loop. Better visibility leads to more interactions, which generates stronger analytics data, ultimately improving your search rankings even further.
Setting up proper tracking systems
Implementing effective GBP analytics requires connecting multiple tracking systems to capture the full customer journey. Start by linking your Google Business Profile to Google Analytics 4 campaign tracking to monitor how GBP interactions convert into website actions and business outcomes.
Set up call tracking numbers specifically for your GBP listing to measure phone conversions accurately. This analytics event tracking approach helps you attribute phone calls directly to your Google Business Profile performance rather than mixing them with other marketing channels.
Create UTM parameters for any links in your GBP posts or website URL to track click-through behavior in your Google Analytics tracker. This analytics tracking setup allows you to see which GBP content drives the most valuable website traffic and conversions.
Configure Google Analytics tracking events for key actions like contact form submissions, appointment bookings, or quote requests that originate from GBP traffic. Your analytics tracking plan should include specific goals and conversion tracking for GBP-generated leads.
Consider implementing Google Analytics tracking pixels on key pages to monitor user behavior after they arrive from your business profile. This comprehensive analytics tracker approach provides complete visibility into the customer journey from initial GBP discovery through final conversion.
Connecting analytics to business outcomes
Transform your GBP analytics data into actionable business intelligence by connecting profile metrics to actual revenue and customer acquisition costs. Track how phone calls from your business profile convert into paying customers compared to other lead sources.
Analyze the correlation between direction requests and in-store purchases or service bookings. This connection helps you understand the true value of foot traffic generated through your Google Business Profile optimization efforts.
Monitor seasonal patterns in your GBP analytics to identify peak demand periods and adjust your marketing strategy accordingly. Understanding when customers most frequently search for your services allows you to optimize post timing and promotional campaigns.
Calculate the lifetime value of customers acquired through different GBP interactions. Customers who call directly might have higher conversion rates, while those requesting directions might represent larger transaction values. This analysis helps you prioritize which analytic metrics deserve the most attention and optimization effort.
Use your analytics data to identify content gaps and optimization opportunities. If certain types of posts generate more engagement or specific photos receive higher view counts, double down on similar content strategies to maximize your profile’s performance impact on business growth.
Mastering Phone Call Tracking and Analysis

Enabling Call Tracking in Your GBP Dashboard
Setting up call tracking in your Google Business Profile dashboard requires accessing the right settings within your GBP interface. Navigate to your business profile and look for the “Insights” section, where you’ll find detailed analytics tracking Google provides for all customer interactions. The phone number display on your profile automatically tracks calls when customers click the call button directly from your listing.
Your GBP analytics will start capturing call data once you verify your business phone number is correctly listed and formatted. The system tracks calls initiated through your Google listing, providing valuable metrics about customer engagement. Make sure your phone number appears consistently across all Google platforms to ensure accurate analytics event tracking.
For businesses using multiple phone numbers, Google Analytics 4 tracking can help you distinguish between different call sources. Set up call extensions in your Google Ads campaigns to create comprehensive analytics tracking plans that cover both organic GBP calls and paid advertising interactions.
Identifying Peak Calling Times and Patterns
Call pattern analysis reveals when your customers are most likely to reach out, helping you optimize staffing and response strategies. Your GBP dashboard displays call frequency by hour, day, and month, creating a clear picture of customer behavior patterns. This analytics tracker functionality shows you exactly when your phone rings most often.
Peak calling times typically vary by industry and location. Restaurants might see spikes during lunch and dinner planning hours, while service businesses often receive more calls during standard business hours. Weekend patterns differ significantly from weekday trends, and seasonal businesses experience dramatic fluctuations throughout the year.
The data shows you can expect higher call volumes on specific days. Monday mornings often generate increased activity as customers plan their week, while Friday afternoons might see a drop in business-related calls. Holiday periods create unique patterns that your google analytics tracking events will capture over time.
Use this information to:
- Schedule adequate staff during busy periods
- Prepare automated responses for off-hours
- Plan marketing campaigns around high-engagement times
- Adjust business hours to match customer demand
Measuring Call Quality and Conversion Rates
Call quality measurement goes beyond counting total calls – you need to track which calls actually convert into customers. Your analytics tracking setup should distinguish between informational calls, appointment bookings, and direct sales inquiries. This level of detail helps you understand the true value of your GBP listing.
Track call duration as a quality indicator. Longer conversations often signal genuine interest, while quick hang-ups might indicate wrong numbers or dissatisfied customers finding outdated information. Calls lasting 30 seconds or more generally represent legitimate business inquiries worth analyzing.
Monitor conversion metrics by categorizing incoming calls:
| Call Type | Duration | Conversion Likelihood | Follow-up Required |
|---|---|---|---|
| Information Request | 1-3 minutes | Medium | Email/Text |
| Service Booking | 3-8 minutes | High | Confirmation Call |
| Complaint/Issue | 2-15 minutes | Low | Resolution Follow-up |
| Sales Inquiry | 5-20 minutes | Very High | Proposal/Quote |
Your google analytics tracking method should connect phone calls to actual business outcomes. Ask callers how they found your business to verify GBP attribution. Train staff to collect this information during conversations, creating a direct link between your Google listing performance and revenue generation.
Implement call recording systems where legally permitted to review conversation quality and identify improvement opportunities. This analytics tracker approach helps you understand what information customers seek most often, allowing you to update your GBP listing with frequently requested details.
Optimizing Direction Request Performance

Analyzing location-based search trends
Understanding your GBP analytics reveals fascinating patterns about how customers search for directions to your business. Peak direction requests often correlate with specific times, events, or seasonal activities in your area. Most businesses see direction spikes during lunch hours, weekends, and holiday shopping periods, but your unique patterns depend on your industry and local demographics.
Geographic data shows where your customers originate, helping you identify untapped markets nearby. If you notice consistent direction requests from a particular neighborhood but few actual visits, this signals an opportunity to improve your local marketing efforts or address potential barriers like parking availability or store accessibility.
Weather patterns significantly impact direction requests. Retail stores typically see fewer direction requests during heavy rain or snow, while indoor entertainment venues might experience the opposite trend. Restaurants often notice increased direction requests during pleasant weather when people prefer dining out.
Improving map visibility and accuracy
Your Google Business Profile’s map performance directly affects direction request volume. Verify that your business location pin appears exactly where customers can find your physical entrance. Even small discrepancies can frustrate potential visitors and reduce conversion rates from directions to actual visits.
Regular audits of your business information ensure accuracy across all map platforms. Check that your hours, address, phone number, and business category remain current. Outdated information creates friction in the customer journey and negatively impacts your local search rankings.
High-quality photos of your storefront, parking area, and nearby landmarks help customers navigate confidently. Include images showing your business from different angles, especially the view customers see when approaching from main streets or parking lots. These visual cues reduce the time customers spend searching for your location.
Tracking seasonal direction patterns
Seasonal analytics tracking reveals valuable insights about customer behavior throughout the year. Holiday seasons typically generate different direction request patterns compared to regular periods. Retail businesses often see direction spikes during Black Friday, back-to-school periods, and December shopping rushes.
Service-based businesses experience different seasonal patterns. Tax preparation services peak in early spring, while landscaping companies see increased direction requests during growing seasons. Understanding these cycles helps you prepare inventory, staffing, and marketing campaigns accordingly.
Weather-related direction patterns provide another layer of insight. Beach towns see direction request surges during summer months, while ski resorts peak in winter. Even non-seasonal businesses notice weather impacts – people request fewer directions during extreme temperatures or severe weather conditions.
Converting directions into store visits
The gap between direction requests and actual visits represents missed opportunities. Analytics event tracking helps identify where customers drop off in their journey. Common barriers include confusing parking situations, unclear store entrances, or unexpected closures during posted hours.
Creating a seamless transition from digital directions to physical arrival improves conversion rates. Clear signage, adequate lighting, and accessible parking encourage customers who requested directions to complete their visit. Consider the customer’s perspective when they arrive – what do they see first, and how easily can they identify your business?
Follow-up engagement strategies help convert direction requests into sales. If your GBP analytics show high direction volumes but low foot traffic, investigate potential obstacles. Survey customers about their experience finding your location, and address common complaints promptly.
Tracking the customer journey from direction request to purchase provides valuable ROI data for your local marketing efforts. This information helps justify marketing spend and identify which promotional campaigns generate the most valuable foot traffic.
Maximizing Website Click Analytics

Understanding click-through rate benchmarks
Website clicks from your Google Business Profile represent one of the most valuable conversion actions you can track. Most businesses see click-through rates ranging from 2-8%, with local service providers often hitting the higher end of this spectrum. Healthcare practices typically achieve 6-12% CTRs, while restaurants and retail stores usually land between 3-7%.
Your GBP analytics dashboard shows total clicks, but the real power comes from analyzing patterns. Look for seasonal fluctuations, day-of-week variations, and how special promotions impact your numbers. Businesses with strong visual content and updated hours information consistently outperform those with stale profiles.
Compare your performance against industry standards, but remember that location density matters. Urban businesses face more competition but also have larger audiences, while rural businesses might see lower absolute numbers with higher conversion rates.
Identifying high-performing content and offers
Your Google Business Profile posts drive website clicks differently based on content type and timing. Product showcases with clear pricing generate 40-60% more clicks than generic announcements. Event posts create urgency and often see click spikes within 24-48 hours of publication.
Track which post formats work best for your audience:
- Photo posts: Visual products or services
- Video posts: Behind-the-scenes content or demonstrations
- Offer posts: Limited-time promotions with clear CTAs
- Event posts: Workshops, sales events, or seasonal activities
Use Google Analytics 4 tracking to see which GBP-driven traffic converts best on your website. Set up custom events to track specific actions visitors take after clicking from your profile. This data helps you double down on content that not only gets clicks but actually drives business results.
Monitor your post engagement metrics weekly and identify patterns. Posts published on Tuesday-Thursday typically see higher engagement, while weekend posts work better for restaurants and entertainment venues.
Tracking user behavior after clicks
Once visitors land on your website from your GBP, their journey tells you everything about your profile’s effectiveness. Google Analytics 4 campaign tracking lets you segment this traffic and analyze behavior patterns that differ from other sources.
Set up custom UTM parameters for different GBP elements:
- Posts: utm_source=gbp&utm_medium=post&utm_campaign=monthly_special
- Profile clicks: utm_source=gbp&utm_medium=profile&utm_campaign=main_website
GBP traffic typically shows higher intent than general search traffic. These visitors already know your business name and location, so they’re further along in the buying process. You’ll often see:
- Lower bounce rates (30-50% vs 60-70% average)
- Higher pages per session
- Better conversion rates for local services
- Shorter time-to-conversion cycles
Create specific landing pages for GBP traffic that match the expectations set in your profile. If someone clicks from a post about your new service, don’t send them to your homepage – create a dedicated page that continues the conversation.
Use Google Analytics event tracking to monitor micro-conversions like phone number clicks, contact form submissions, or appointment bookings from GBP visitors.
Optimizing for mobile click performance
Mobile devices account for 80-90% of GBP interactions, making mobile optimization critical for maximizing website clicks. Your profile appears differently on mobile versus desktop, with the website button more prominent on smaller screens.
Mobile users behave differently than desktop visitors. They want immediate answers and quick actions. Optimize your GBP for mobile by:
- Using mobile-friendly website links that load quickly
- Creating clear, action-oriented CTAs in posts
- Ensuring your website is fully responsive
- Adding click-to-call functionality prominently
Test your GBP on different devices regularly. What looks perfect on your computer might be harder to navigate on a phone. The “Website” button placement changes based on how many other action buttons you have active.
Mobile analytics tracking requires special attention to page load speeds and user experience. Use Google Analytics’ mobile reporting to see how GBP mobile traffic performs compared to other mobile sources. Mobile visitors from GBP often have higher commercial intent but less patience for slow-loading pages.
Consider creating mobile-specific landing pages for your GBP traffic, especially if you’re running location-based promotions or time-sensitive offers that mobile users are more likely to act on immediately.
Advanced Reporting and Data Interpretation

Creating custom dashboards for stakeholders
Building effective custom dashboards transforms raw GBP analytics into actionable intelligence for different stakeholder groups. Business owners need high-level performance summaries showing total phone calls, direction requests, and website clicks alongside conversion rates and revenue attribution. Marketing teams require deeper dive capabilities, focusing on campaign performance correlation with GBP click patterns and Google Analytics 4 tracking integration.
Design dashboards with role-specific metrics that align with business objectives. Executive dashboards should emphasize ROI metrics, comparing GBP performance against advertising spend and customer acquisition costs. Operations teams benefit from location-specific breakdowns, showing peak call times, direction request patterns, and service area demand fluctuations.
Implement automated reporting schedules using Google Analytics tracker data to keep stakeholders informed without manual intervention. Connect GBP analytics with existing analytics tracking systems to provide comprehensive performance views. Include visual elements like heat maps for geographic performance and trend lines for temporal analysis.
Consider mobile-responsive dashboard designs since stakeholders often review performance on mobile devices. Integrate real-time alerts for significant performance changes, ensuring immediate response to opportunities or issues. Custom dashboards should allow drill-down capabilities, enabling users to move from summary views to granular analytics event tracking details.
Identifying actionable insights from raw data
Raw GBP analytics data contains valuable patterns that drive strategic decisions when properly interpreted. Call timing patterns reveal optimal hours for staffing and promotional campaigns, while direction request clustering identifies high-potential service areas for expansion. Website click analysis through Google Analytics 4 campaign tracking shows which business information elements drive the most engagement.
Segment performance data by time periods, customer demographics, and interaction types to uncover hidden opportunities. Weekend vs. weekday performance variations often reveal different customer behavior patterns that inform marketing strategy adjustments. Seasonal trends in direction requests can guide inventory planning and service scheduling.
Cross-reference GBP performance with external factors like weather patterns, local events, and competitor activities. This correlation analysis helps predict performance fluctuations and optimize resource allocation. Use analytics tracking plans to establish baseline metrics and identify statistically significant performance changes.
Focus on conversion funnel analysis by tracking the customer journey from GBP impression to final action. Identify drop-off points where potential customers disengage and implement targeted improvements. Monitor user behavior flow using web analytics tracking tools to understand how GBP traffic converts on your website.
Comparing performance across multiple locations
Multi-location businesses require sophisticated analytics tracking methods to identify top-performing locations and replicate success factors. Establish standardized metrics across all locations while accounting for local market differences, demographic variations, and competitive landscapes. Use Google Analytics tracking parameters to segment location-specific performance accurately.
Create performance benchmarking systems that account for market size, population density, and local competition levels. Raw comparison numbers can mislead when markets differ significantly in opportunity size. Develop normalized metrics that allow fair comparison between urban high-traffic locations and smaller suburban markets.
| Performance Metric | Urban Location | Suburban Location | Rural Location |
|---|---|---|---|
| Calls per 1000 views | 45 | 38 | 52 |
| Direction requests/day | 125 | 78 | 23 |
| Website clicks rate | 12.3% | 9.8% | 15.1% |
| Conversion rate | 3.2% | 4.1% | 6.8% |
Identify best practices from high-performing locations by analyzing their GBP optimization strategies, content approaches, and customer engagement tactics. Document successful tactics and create implementation guides for underperforming locations. Regular performance review meetings should focus on sharing insights and strategies across the location network.
Monitor location-specific trends using analytics tracker tools to identify emerging opportunities or declining performance before they significantly impact business results. Implement location performance scorecards that combine multiple GBP analytics metrics into single performance indicators, making it easier to identify locations requiring attention or investment.
Implementing Data-Driven Optimization Strategies

Testing and improving underperforming metrics
When your GBP analytics reveal metrics that aren’t hitting the mark, systematic testing becomes your best friend. Start by identifying patterns in your data – are phone calls dropping off at specific times? Are direction requests consistently low compared to website clicks? The key is breaking down each underperforming area into testable components.
For phone call tracking that’s lagging, experiment with different business descriptions, updated photos, or adjusted business hours. Test one variable at a time over 2-3 week periods to get meaningful data. If direction requests are low, your address might need optimization or your location pins could require verification.
Website click analytics often reveal the most opportunities. Poor click-through rates might stem from outdated photos, weak calls-to-action in your description, or missing information customers need. A/B test different versions of your business description, swap out hero images, and monitor how each change affects your analytics tracking.
Create a simple tracking spreadsheet to document what you test, when you implement changes, and the results. This creates a knowledge base that prevents you from repeating unsuccessful experiments and helps you double down on what works.
Scaling successful tactics across locations
Multi-location businesses have a goldmine of data when certain locations consistently outperform others. Your analytics tracker becomes a roadmap for replicating success across your entire network.
Start by analyzing your top-performing locations using Google Analytics 4 tracking data. Look beyond surface metrics – dig into the timing of interactions, the types of photos that generate the most engagement, and the specific keywords in descriptions that drive results.
Document winning strategies in detail. If Location A gets 40% more phone calls, examine their photo rotation schedule, response time to reviews, and posting frequency. Create standardized templates and processes that other locations can easily implement.
Roll out successful tactics gradually rather than all at once. Pick 3-4 underperforming locations as test cases. Implement the proven strategies and monitor the results for 4-6 weeks before expanding to additional locations.
| Metric | Before Optimization | After Optimization | % Change |
|---|---|---|---|
| Phone Calls | 45/month | 63/month | +40% |
| Direction Requests | 120/month | 156/month | +30% |
| Website Clicks | 89/month | 125/month | +40% |
Cross-location analytics reveal seasonal patterns and regional preferences that individual location data might miss. Use these insights to create location-specific optimization calendars.
Integrating GBP data with other marketing channels
Your GBP analytics don’t exist in isolation – they’re part of a larger marketing ecosystem that includes social media, email campaigns, and paid advertising. Smart integration amplifies the value of every data point you collect.
Connect your Google Analytics tracking with your GBP insights to see the complete customer journey. Someone might discover you through social media, check out your GBP listing, request directions, and then make a purchase. Without connecting these dots, you’re missing crucial conversion paths.
Use analytics tracking tools to create unified reporting dashboards. When you see a spike in GBP direction requests, check if it correlates with a recent social media campaign or email blast. This helps you understand which marketing channels work best together.
Set up UTM parameters for campaigns that might drive GBP traffic. If you’re running a Facebook ad promoting a store location, track whether it leads to increased phone calls and direction requests through your GBP listing. This data helps you allocate marketing budget more effectively.
Your analytics ecommerce tracking should capture the full attribution picture. A customer who calls after seeing your GBP listing represents valuable conversion data that often gets overlooked in traditional web analytics.
Setting realistic goals and KPIs
Effective GBP optimization starts with understanding what’s actually achievable for your business type and location. Generic benchmarks rarely apply to your specific situation, so building realistic expectations prevents frustration and guides smart decision-making.
Analyze your historical data to establish baseline performance. If you typically get 30 phone calls per month, setting a goal of 200 calls next month sets you up for disappointment. Instead, aim for steady 10-15% monthly improvements that compound over time.
Different business types have vastly different “normal” metrics. A restaurant might see high direction requests but moderate phone calls, while a service business might have the opposite pattern. Your KPIs should reflect your industry reality, not general marketing advice.
Create tiered goals based on effort level:
- Low effort: 5-10% improvement (updating photos, optimizing hours)
- Medium effort: 10-20% improvement (regular posting, review responses)
- High effort: 20%+ improvement (comprehensive optimization, integration with other channels)
Track leading indicators alongside lagging indicators. While phone calls and direction requests are important outcomes, monitor the activities that drive them – photo views, listing views, and search appearances. These metrics give you early signals about whether your optimization efforts are working.
Review and adjust goals quarterly based on performance data and external factors like seasonality or market changes. What works in summer might not work in winter, and your analytics tracking plan should account for these variations.
Getting the most from your Google Business Profile analytics means looking at all three key areas: phone calls, direction requests, and website clicks. Each metric tells a different story about how customers find and engage with your business. Phone calls show direct intent to purchase, direction requests reveal foot traffic potential, and website clicks indicate digital engagement levels.
The real power comes from combining these insights to make smart business decisions. Track patterns over time, identify peak engagement periods, and adjust your strategy based on what the data reveals. Use this information to optimize your business hours, update your website content, or improve your local SEO efforts. Start monitoring these metrics regularly and you’ll quickly spot opportunities to grow your customer base and boost your local presence.
FAQs
What is GBP analytics tracking and why should I care about it?
GBP (Google Business Profile) analytics tracking lets you see how customers interact with your business listing on Google. You can track when people call your business, ask for directions, or click to visit your website. This data helps you understand which actions customers take most often and how well your online presence is working.
How do I see phone call data from my Google Business Profile?
Go to your Google Business Profile dashboard and click on “Insights.” Look for the “Actions” section where you’ll find phone call metrics. You can see how many people called your business directly from your Google listing, when they called, and compare this data over different time periods.
Can I track which direction requests came from my business listing?
Yes, Google Business Profile shows you how many people requested directions to your business. In the Insights section, you’ll find direction requests under “Actions.” This tells you how many people wanted to visit your physical location after finding you on Google.
What counts as a “click” in GBP analytics?
Clicks in GBP analytics include various actions like clicking on your website link, clicking your phone number, clicking for directions, or clicking to view photos. Each type of click is tracked separately so you can see which parts of your listing get the most attention.
How often does Google update my business profile analytics data?
Google typically updates your analytics data within 24-48 hours. Some metrics might take up to 3 days to appear in your dashboard. The data refreshes automatically, so you don’t need to do anything to get the latest information.
Why don’t I see any phone call tracking data in my analytics?
If you’re not seeing phone call data, make sure your phone number is correctly added to your Google Business Profile. Also, calls only get tracked when people click the phone number directly from your Google listing. Calls made by manually dialing your number won’t show up in these analytics.
Can I export my GBP analytics data to use in other tools?
Currently, Google doesn’t offer a direct export feature for Business Profile analytics. You’ll need to manually record the data or take screenshots if you want to use it elsewhere. Some third-party tools can help collect this data, but you’d need to research which ones work best for your needs.
What’s the difference between website clicks and other types of clicks?
Website clicks happen when someone clicks the link to visit your website from your Google Business Profile. Other clicks include actions like viewing photos, getting directions, or calling your business. Each action type is tracked separately to give you a clearer picture of customer behavior.
How far back can I view my GBP analytics data?
Google Business Profile analytics typically shows data for the past 18 months. You can choose different time ranges like the last 7 days, 30 days, or 3 months. The longer time periods help you spot trends and seasonal patterns in customer behavior.
What should I do if my analytics show low engagement numbers?
If your numbers are low, start by making sure your business information is complete and accurate. Add high-quality photos, respond to customer reviews, and keep your hours updated. Also, encourage satisfied customers to leave reviews, as this can boost your visibility and encourage more people to interact with your listing.